This example is about Tokyo Ueno area.
Considering about undulating terrain can be ignored when thinking about how various means of transportation shrink cities. When trying to consider about this effects, calculating the ratio of walking speed to the other speed of transportation. In this article, we will show “Time Distance Map” of a city, which has various transportation.
The above animation shows traveling time distance map when a traveler move from his origin to destination.
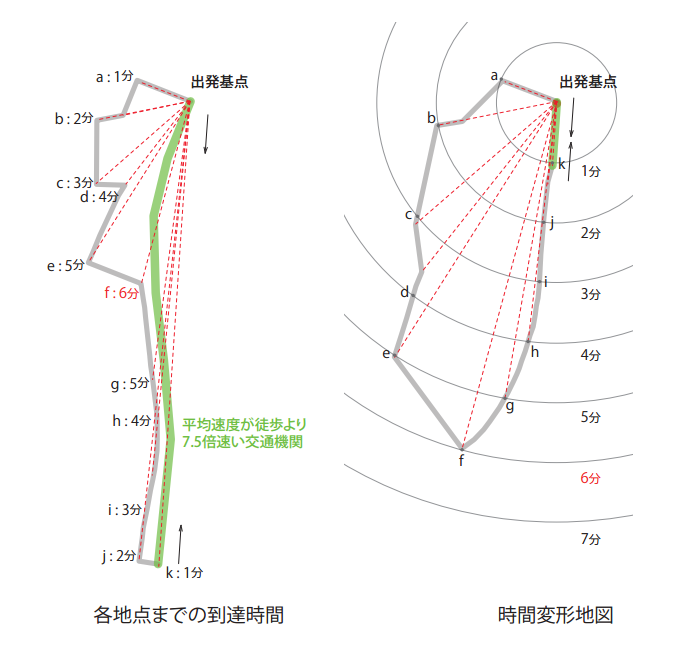
The procedure of drawing time distance map.
- Calculating shortest path and time from a present point.
- Drawing concentric circles at regular intervals (1 minutes).
- Moving all points with preserving the angle between origin and each point according to the amount of time.
Transportation network as a device of shrinking city.
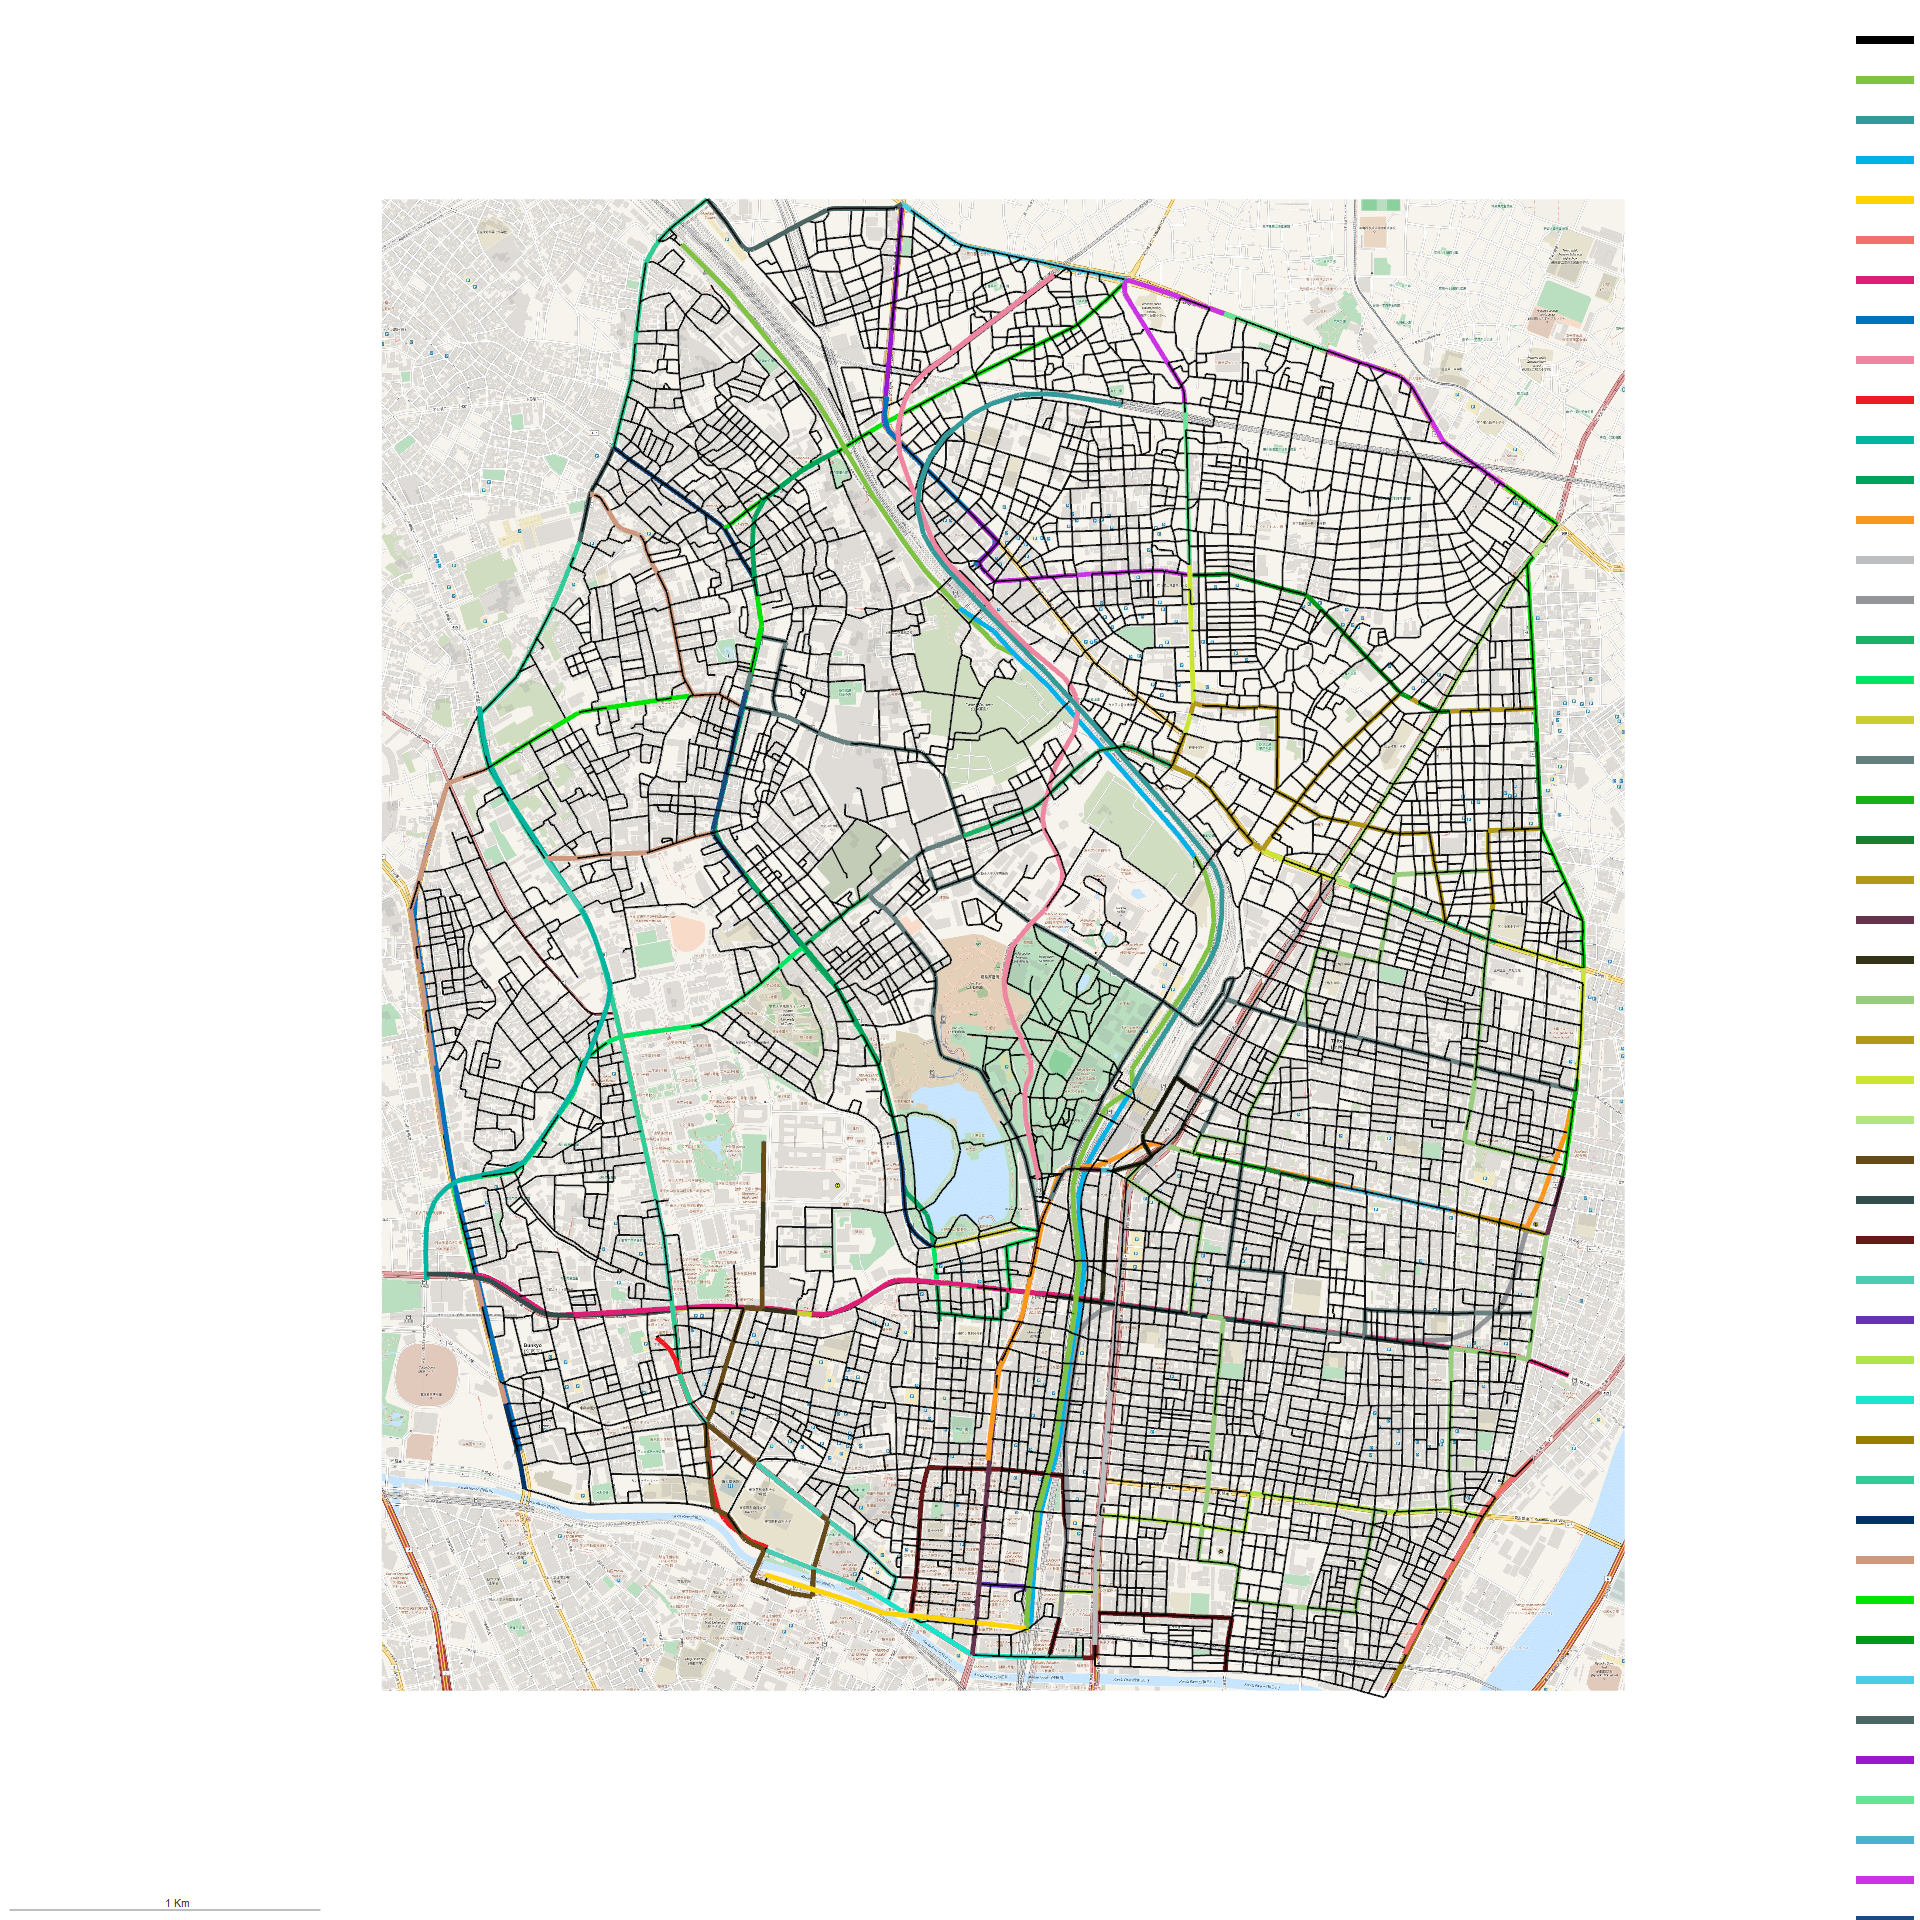
(c) OpenStreetMap contributors, CC-BY-SA
There are 14 trains and 33 buses lines in Ueno, Tokyo. StreetView, analysis software developed by hclab., provide time distance map when you select a point in Ueno. When drawing time distance map considered directional weighted graph, we can realize how distant points gravitate toward origin (or any other arbitrary points) . Time distance map is a map which focus on time. When we consult this map, transportation looks like devices which deforms distance.
Considering about waiting time
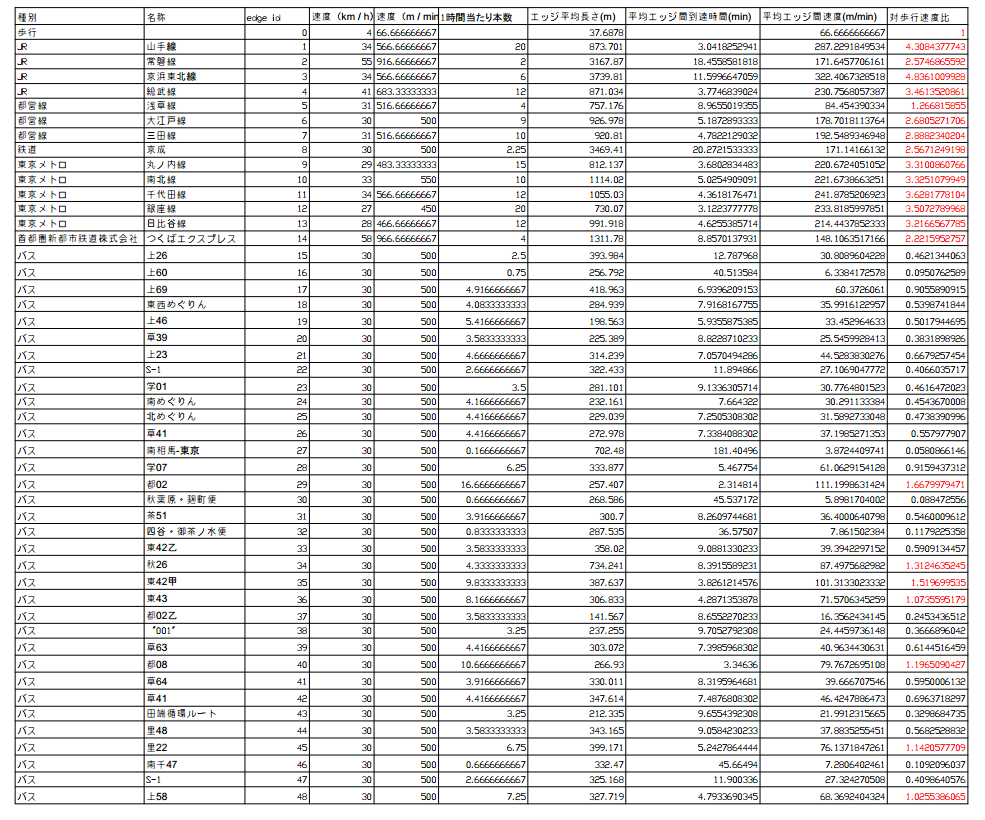
Considering about ratio of various speed of movement is not sufficient because we must have waiting time of transportation. For example, ratio of walking (average 4km/h) to bus (average 30km/h) is 1:7.5, but actually it sometimes takes more time when considering interval of bus schedule.
Strictly speaking, time distance map changes without a pause when considering waiting time, but we can show an average time distance map by calculating average waiting time from time tables of train and bus. As a result, we realize that move by foot is faster than by bus excluding 5 lines of total 33 lines. We don’t have motivation that we use these 28 lines in terms of traveling efficiency. As a rough estimation, we got the result that lines of bus can shrink distance between bus stops when the frequency of service is more than 8 per hour in case of interval between bus stop is shorter than 300m, or the frequency of service is more than 5 per hour in case of interval between bus stop is shorter than 700m.